

Problem
When reporting in Power BI you often want to filter a page or visual on a rolling number of periods, e.g. Last 12 months, Last Calendar Year or Last 2 weeks. When you tick over to a new week, month or year the filter should automatically adjust. For Calendar dates the standard Date Slicer will work once you change it to relative dates and then add the relevant date as a filter to the visual or page.
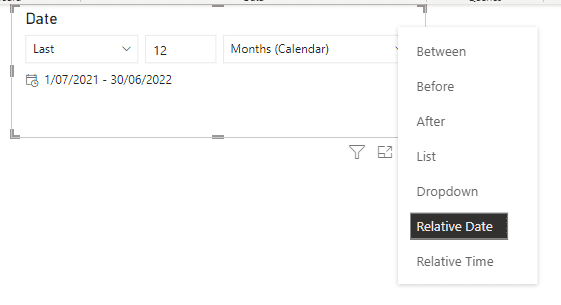
Calendar Weeks can be problematic if you want to report on a different start of the week than the standard in Power BI. The standard is for the week to start on Sunday and cannot be changed. If your weeks start on a different day then the Relative Date slicer will not work.
The problem I had was the report needed to use financial periods rather than the calendar months. Financial periods differ for various reasons, for example, some companies have the period end at the end of the week rather than in the middle or have a shorter period for December.
Adding the Date Slicer as a Date Range and asking the user to pick dates is not very user friendly. Ideally you want to set this automatically.
This article assumes familiarity with Power BI and DAX.
Prerequisite
You will need to have a Custom Date Table in your model that contains the financial periods. If you need help creating a Date table visit RADACAD and they have many articles about creating one using Power Query or DAX.
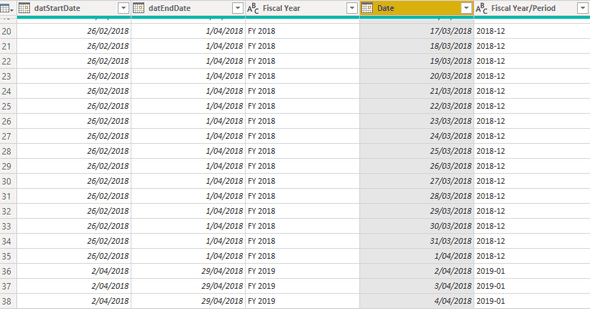
Your date table will need to look something like this, where you have a list of all dates in sequence and another column that defines the financial periods/weeks that you need. It is important that your period column can be sorted so try to use something like YYYY-PP. If you need to display different values in the report add another column with that specific format.
My table had the start and end of period as well, but that is not completely necessary, although it makes it easier. In my example the start of the financial year is April so April 2022 would be 2023-01. The table was called "DIM Date", the period column was "Fiscal Year/Period" and the period start was "datStartDate".
Solution
-
Create a new table using DAX. Goto the "Modelling" ribbon and select "New table"
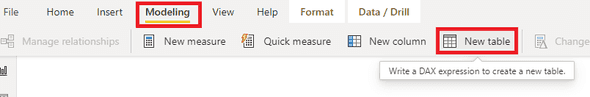
Create new table -
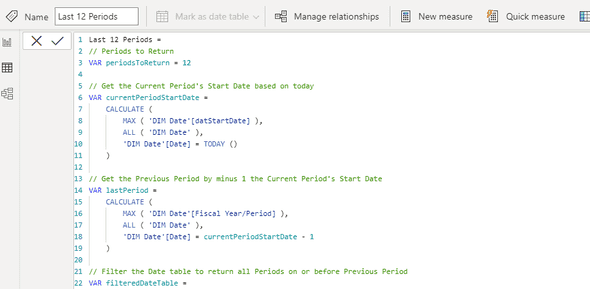
Enter the DAX code as below (scroll to the end for the full code) and replace it with your fields and table names. The example below is for the last 12 completed periods which excludes the current period. Give it a name such as "Last 12 Periods". The DAX calculation is broken down as follows:
DAX Code -
Firstly you need to get the last completed period. I used today's date and the period start date to get the previous period.
// Get the Current Period's Start Date based on today VAR currentPeriodStartDate = CALCULATE ( MAX ( 'DIM Date'[datStartDate] ), ALL ( 'DIM Date' ), 'DIM Date'[Date] = TODAY () ) // Get the Previous Period by minus 1 the Current Period's Start Date VAR lastPeriod = CALCULATE ( MAX ( 'DIM Date'[Fiscal Year/Period] ), ALL ( 'DIM Date' ), 'DIM Date'[Date] = currentPeriodStartDate - 1 ) -
Then Filter the Date table to return all Periods on or before Previous Period. This will give you a list of all periods.
VAR filteredDateTable = FILTER ( ALL ( 'DIM Date'[Fiscal Year/Period] ), 'DIM Date'[Fiscal Year/Period] <= lastPeriod ) -
Finally use TOPN to get the number of periods that you want to return, in this case 12.
VAR periodsToReturn = 12 VAR topNPeriods = TOPN ( periodsToReturn, filteredDateTable, 'DIM Date'[Fiscal Year/Period] ) RETURN topNPeriods -
The new table should have an output that lists the last 12 completed periods.
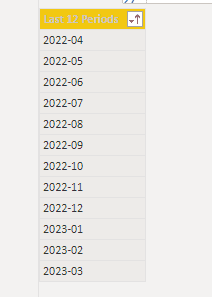
Last 12 Periods table data
-
-
Create a join in your model between the Date table and your new table
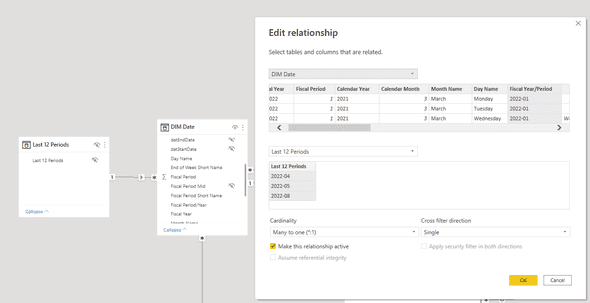
Join between new DAX Table and Date table -
Now you can add the new field to the visual, page or report filter as required. Make sure to filter it as where it is not blank.
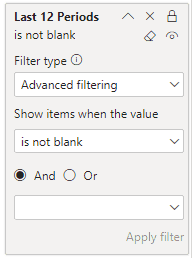
Filter by the new table
The full DAX code is below:
Last 12 Periods =
// Periods to Return
VAR periodsToReturn = 12

// Get the Current Period's Start Date based on today
VAR currentPeriodStartDate =
    CALCULATE (
        MAX ( 'DIM Date'[datStartDate] ),
        ALL ( 'DIM Date' ),
        'DIM Date'[Date] = TODAY ()
    )

// Get the Previous Period by minus 1 the Current Period's Start Date
VAR lastPeriod =
    CALCULATE (
        MAX ( 'DIM Date'[Fiscal Year/Period] ),
        ALL ( 'DIM Date' ),
        'DIM Date'[Date] = currentPeriodStartDate - 1
    )

// Filter the Date table to return all Periods on or before Previous Period
VAR filteredDateTable =
    FILTER (
        ALL ( 'DIM Date'[Fiscal Year/Period] ),
        'DIM Date'[Fiscal Year/Period] <= lastPeriod
    )

// Get the Top N periods
VAR topNPeriods =
    TOPN ( periodsToReturn, filteredDateTable, 'DIM Date'[Fiscal Year/Period] )
RETURN
    topNPeriods
This may not be the best way to do this so happy to hear comments or feedback on it. When I tested it on my reports I had multiple date filters on pages and found the report navigation and performance to be good.
Hopefully someone will find this useful.